
I often use charts to illustrate hard numerical data. Charting gives us the ability to see emerging long term trends. Today, I charted some key fundamental data points to gain some perspective of where we are in the market cycle and what we are paying for at this juncture.
The S&P 500 is often used as a proxy for the stock market. Thus, I plotted four fundamental metrics for the S&P:
- Revenue growth
- Earnings per share (EPS) growth
- Operating margins
- Price-to-earnings multiples (P/E)
This is an extension of my last blog and adds a few more key variables, namely sales growth and operating margins.
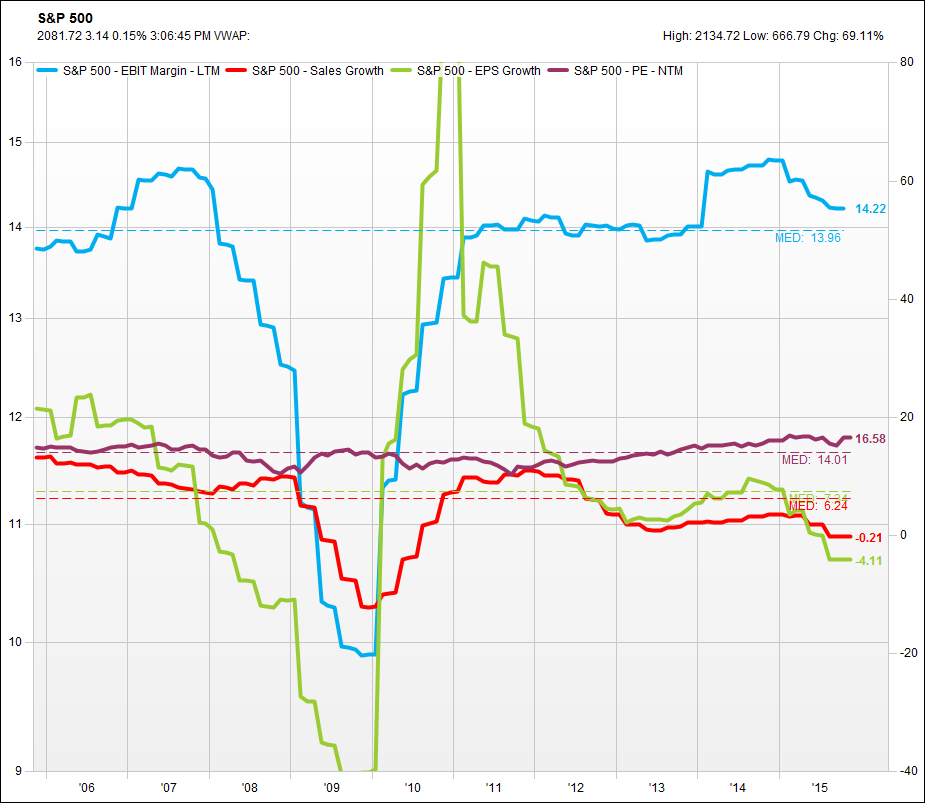 As the thick red line indicates, sales growth for the next 12 months is expected to be negative for the first time since coming out of the great recession of 2008. It is important to note that, unlike last time we were at these levels, we now have a negative slope to the line.
Over the past 10 years, annual sales growth has been 6.24% as represented by the red dashed line. In comparison, growth in EPS fares even worse than revenue growth.
As the thick green line indicates, EPS is also downward sloping and in negative territory for the first time since emerging from the great recession. Currently, EPS growth for the next 12 months is expected to decline by 4.11% versus its 10-year average growth rate of 7.34%.
The third important variable is operating margins. Since peaking at all-time highs at the end of 2014 we have seen operating margins (a measure of profitability represented by the thick blue line) come down.
And what are we paying for all of this? The answer is above average P/E multiples. As represented by the thick maroon line, the S&P 500 currently is selling at 16.58x the next 12 months’ EPS. This compares to a 10-year average next 12 months P/E of approximately 14x.
When I sit back and look closely at the chart I see falling revenue and EPS trends to actual negative levels and at points well below historical averages. I notice operating margins have peaked and are now coming down from record levels. Lastly, I see the market asking investors to pay a market premium for this backdrop.
Add in the risk of a rising interest rate environment from the Federal Reserve and I have a hard time getting excited about buying the market. As always, there will be individual stocks with different characteristics as that of the overall market. However, when choosing stocks, one finds it challenging and frustrating to find a good fundamental set up.
My final observation is the market is too expensive for declining revenue growth, declining EPS growth and declining operating margins. Given the fundamental backdrop, waiting for more attractive valuations appears to be the most prudent approach at this time.